Performance and Power Tracing Framework
With the increasing number of nodes and CPUs, the understanding of applications' runtime behavior is vital to achieve best performance. To this end, tracing and profiling tools are used. Among the commonly used are VampirTrace and Vampir, which are profiling/tracing and visualization tools, respectively. pmlib is an add-on module that can be used to collect more system statistics.
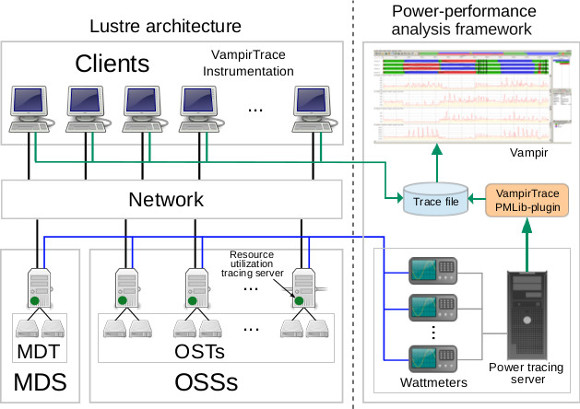
The right part of the above figure illustrates a typical set-up of a tracing and profiling framework. To collect traces, the applications have to be compiled using the VampirTrace compiler wrappers that automatically instrument the code. The generated binary runs on the client nodes. Wattmeters are used to collect the power consumption of the connected devices. A dedicated server that stores the traces is used.
The left hand side of the above figure displays the connection between I/O serves and clients (in this case, the Lustre parallel file system is being used). In this configuration, we plug the I/O servers to the wattmeters that account for the consumed energy and send the power data to the tracing server.
The attached VampirTrace plugin for pmlib employs the client API that sends start/stop primitives in order to gather captured data by the wattmeters onto the tracing server that hosts an instance of the pmlib server. Once the application's run has finished, the VampirTrace plugin receives the power data from the tracing server. The instrumentation post-process generates the performance trace files and the pmlib plugin inserts the power data into them.
In addition to the power measurements, using the pmlib we can also collect other resource utilization values of the servers such as CPU load, memory usage and storage device utilization.
For this reason, we run special pmlib server instances on the server nodes that retrieve these values from the proc file system (leveraging the Python library psutil).
Thus, pmlib plugin instances running with the instrumented application connect with the pmlib servers and also receive resource utilization data of the I/O servers.
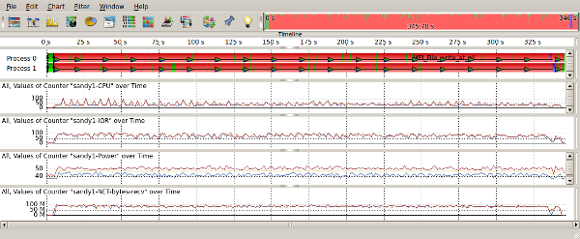
The picture below shows a screenshot of the Vampir visualization tool where the power-performance traces can be easily analyzed through a series of plots and statistics.
Test case:
The following figure displays a fragment of the visualization output of the Vampir visualization tool. In this example, we have used the IOR benchmark to issue writes to the I/O servers. Vampir trace as recorded on one of the I/O storage servers while running our IOR benchmark. In this scenario, the server alternates between idle and I/O states that correspond to the computation and I/O activity phases on the client side.
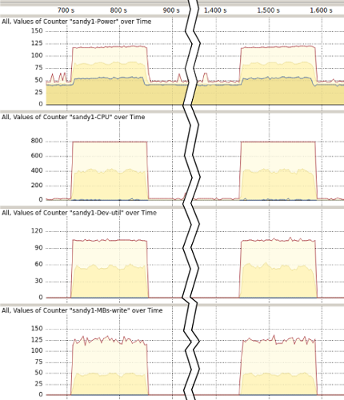
The top of the above figure shows the trace's timeline. As can be seen, the trace excerpt starts at around 670 s into the benchmark run and ends at approximately 1,620 s. The spikes on the left and right of the figure show I/O activity. To be able to focus on these important parts, we do not show most of the idle period in the middle. Our pmlib server collected data for the power consumption, CPU utilization, as well as HDD utilization and throughput. As can be seen, while the I/O server is being heavily utilized during the I/O phases, it is mostly idle during the computation phases. Since Vampir is not able to show all recorded values due to the lower screen resolution, it draws three lines representing the minimum, the average and the maximum for each of the values.
Links
- S. Barrachina et al., “An Integrated Framework for Power-Performance Analysis of Parallel Scientific Workloads,” 3rd Int. Conf. on Smart Grids, Green Communications and IT Energy-aware Technologies, 2013, pp. 114–119.
- Konstantinos Chasapis, Manuel Dolz, Michael Kuhn, Thomas Ludwig, “Evaluating Power-Performace Benefits of Data Compression in HPC Storage Servers,” 4th Int. Conf. on Smart Grids, Green Communications and IT Energy-aware Technologies, 2014, pp. 29–34